Net Zero and GHG Emissions

The aim of Net Zero GHG emissions is to stabilise global average temperatures, it is hoped that it can be achieved at 1.5C over pre-industrial levels. The calculation of CO2e for each of the GHG gases needs to take into account the impact of each of these gases upon global average temperatures. For CO2, it is quite simple: just take the quantum of the emissions themselves. 400 parts per million of CO2 equals 400 parts per million tonnes of CO2e. Since N2O has a half life of around 120 years, the normal calculation to convert to CO2e applies. In this case, 300 parts per billion of N2O equals 89 parts per million of CO2e. For the other gases a different calculation must apply. Since the other gases have a half life that significantly impacts their warming potential (methane has a half life of 9.5 years), we cannot just keep adding these warming potentials into our CO2e values. We have to take into account the progressive reduction in the atmospheric levels of these gases from previous emissions. For each year, we can (roughly) add the current emissions into CO2e, but we also have to deduct the losses into the atmosphere from previous years.

Net Zero from methane

For methane, we can simply deduct the losses attributable to the methane emissions in prior years.

  • Year -1: 4.75%
  • Year -2: 13.80%
  • Year -3: 21.99%
  • Year -4: 39.40%
  • Year -5: 36.11%
  • And so on into infinity.

If the world reduces the absolute value of methane emissions in each year, this gives us all a negative CO2e value that can be shared around amongst all nations. This will soften the required reductions in regard to continuing emissions of CO2 and N2O. This negative impact will continue out to 2100 if the reductions in these gases are sufficiently large. It can also go beyond this if the absolute reductions continue. For methane, the most significant element in total emissions consists of the fugitive emissions from coal extraction and natural gas extraction, transportation and use, so it is important to cut these as the first priority.

Emissions of methane are currently around 800 million tonnes. Of this total, about 26% can be attributed to coal and gas fugitive emissions (including the failure to manage leaks properly, especially around the year 1990; some mismanagement is still continuing). If coal use were entirely eliminated, natural gas cut down to only 20% of the current use (for non-energy industrial purposes only), “leaks” of natural gas cut to a “normal level”, and emissions from ruminants and rice production continued in line with population, the emissions of methane each year would be about 670 million tonnes. This reduction of 130 million tonnes of methane per year, would represent a negative CO2e, starting at zero for 2030 and growing to 3,250 million tonnes per year by 2050.

Negative CO2e from refrigerant gases

The warming potential from refrigerant gases is expected to decline from 2025, due to the further implementation of the Montreal Protocol. The atmospheric level of these gases should reduce from this date. These gases have about half the impact of methane, so let us say that it also represents a negative CO2e, starting a zero in 2025 and growing to negative 1,600 million tonnes per year year by 2050.

Positive CO2e from Nitrous Oxide

Based on the increase in atmospheric N2O, we can calculate that N2O emissions are running at about 320 million tonnes per year. It may be possible to cut emissions arising from agriculture so that the final number were 160 million tonnes per year. Based on radiative forcing at current levels of emissions, this would mean that the net CO2e from nitrous oxide would be about 1,200 million tonnes.

Positive CO2e from CO2

Based on the foregoing, for a Net Zero outcome, CO2 emissions from all sources would need to be capped at about 4,000 millions tonnes. This compares with the 35,000 million tonnes of CO2 emissions in 2018. This was made up as follows:

  • Coal 13,000 tonnes (including about 2,000 tonnes of metallurgical coal and coal used for residential heating).
  • Oil based fuels 9,000 tonnes.
  • Natural gas 6,000 tonnes.
  • Cement production 1,500 tonnes.
  • Other (undefined) 5,500 tonnes.

Preferably, all coal uses would have to go if Net Zero were to be achieved. All electricity production using natural gas would have to go. All oil-based fuels need to be replaced by chemical alternatives, like ethanol or ammonia, or by electric vehicles. Alternative ways of building heating will be required, using electric air conditioning and heat pumps with local geothermal resources.

Each of these things will be a challenge, but the biggest is the complete change in electricity generation. Under Net Zero, there is no place for natural gas after 2050. At present, renewables like wind and solar cannot supply anything like baseload power, even with all types of storage, so new baseload resources will be needed, such as geothermal and modular molten-salt nuclear reactors.

Electric cars are a bit of dream, at least for nations that are not rich or have large distances to cover. For the latter, something like the ethanol-driven approach of Brazil seems to be required.

There is considerable hope for “green steel” and “green cement”. We wait in anticipation.

Carbon capture, utilisation and storage

This is a major feature of a recent report by the IEA. The question for me is whether it really will be secure at the volumes being considered. They go far beyond current storage being undertaken in depleted oil and gas wells, with the risk of subsequent leakage currently not being seriously considered.

Net Zero in 2050 vs 2060

The foregoing is predicated on achieving Net Zero by 2050. Whether this is a viable strategy for all nations is debatable. A date like 2060 could be more achievable.

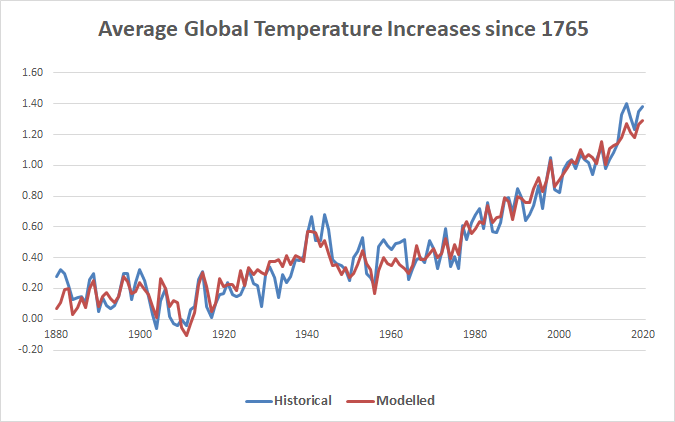
For comparison purposes, I have modelled global average temperatures out to 2070, using two targets. One is that Net Zero, according to my definition, will be achieved in 2050; the other is that Net Zero, on the same basis, is achieved in 2060.

Two scenarios for reaching Net Zero.
Two scenarios for reaching Net Zero

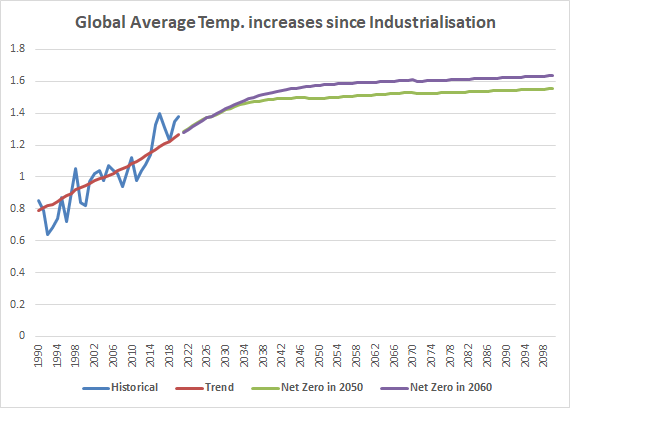
This graph shows that a result close to 1.6C can be achieved, even if (my) Net Zero is not achieved until 2060. Of course, it will be a safer outcome if OECD nations can arrive at that point by 2050.

Conclusion

Net Zero by 2050 may be a pipe dream, but the world could give itself a number more years before we reach a stable 1.5C if urgent action were taken. This is because reduced GHG emissions in the intervening years will reduce the growth in average annual global temperatures. This will involve action on the following issues:

  • Do not build any more coal-fired electricity generators where there are other options available.
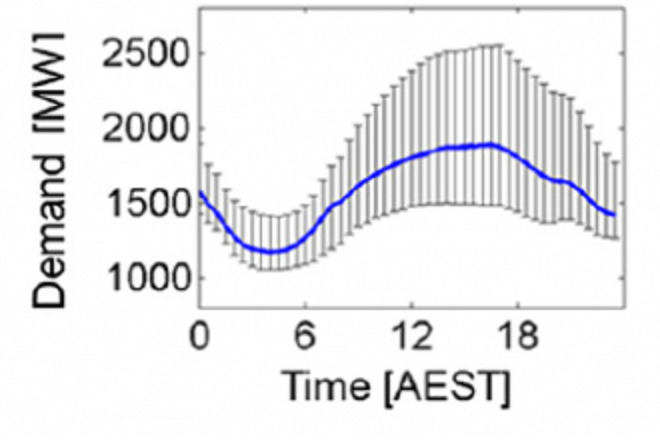
  • Do not use gas-fired generators for anything except for the purpose of meeting peak demand.
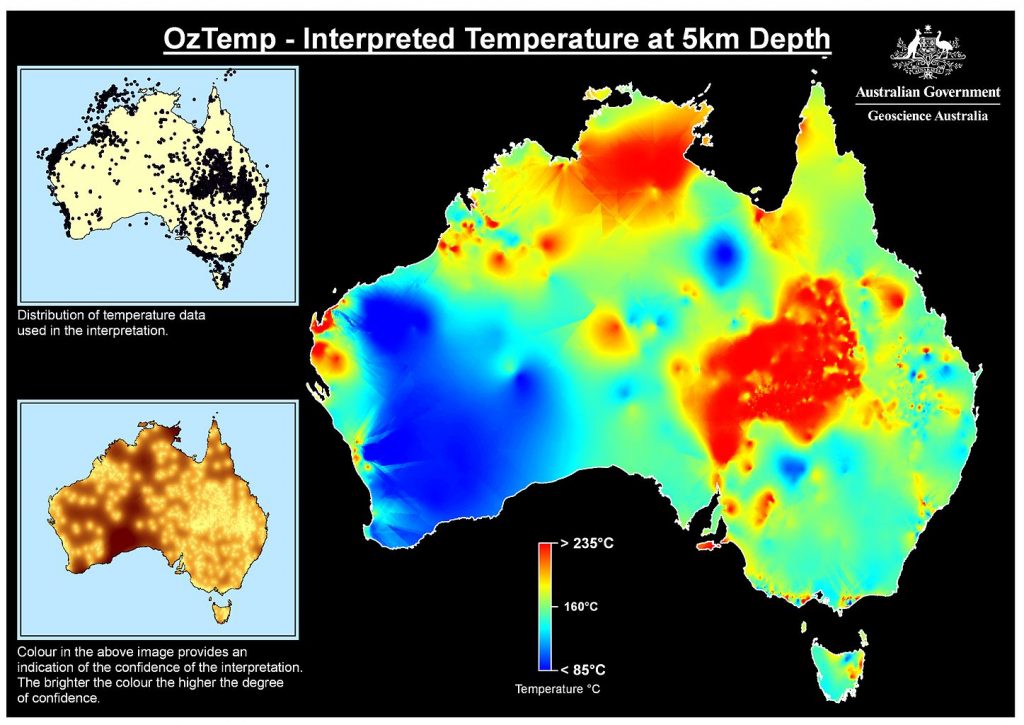
  • Develop geothermal resources where available, and enter into fixed price contracts for the supply of electricity from such resources 24/7 (to ensure that such facilities are not bankrupted by operations that can only provide intermittent supplies.)
  • Governments to push ahead with funding trials for modular molten-salt nuclear-powered electricity generators.
  • Governments to immediately mandate fuel-flex vehicle electronics, so that ethanol can progressively take over as ethanol production increases and where electric vehicles are not suitable for the particular application, or are too expensive.
  • Governments to mandate that ships entering their ports use non-CO2 fuels.
  • Progressively implement reduced N2O agricultural practices as and when the research indicates that this is possible.
  • Governments to mandate that gas not to be used for building heating in new-builds. When electric air-conditioning is not effective in cold climates, governments to mandate that heat pumps using local geothermal methods be used instead.

AEMO Pricing is making the grid unstable

AEMO pricing, which is designed to achieve the lowest wholesale price for electricity gives no weight to maintaining baseload capacity and gives no consideration to reducing CO2 emissions. These things could be fixed to the addition of a baseload element to the pricing model.

In doing all of these things, the objective to be kept in mind is an end result of global average temperature stabilising at 1.5C over pre-industrial levels.

AEMO pricing model should give priority to baseload generation

Once the medium term baseload demand has been set, those generators that can provide supply that is not dependent on the wind or sun should not be put out of business just because there is a cheaper option. That is current situation. It has already happened with the Pt. Augusta generators where the Chinese-owned operator has demolished the plant so that it can never be used again, even in a crisis.

Unless a change is made in the AEMO pricing model the grid is in danger of all baseload operators being shut down solely to meet the short-term economics of the current model. In this case, the entire grid will be dependent upon the vagaries of the wind and the cloud cover. Even with storage, this will mean that, at times, there will be virtually no electricity supply at all. This should not be allowed to happen.

Wind and solar cannot provide true baseload capacity. This is because it is dependent upon the prevailing climatic conditions, even with storage. The underlying baseload capacity should not come from natural gas: that power source is better suited to meeting demand peaks and is priced accordingly. Hydro and pumped-hydro should also not count, since that depends upon climatic conditions. That is to say, a long drought can knock out hydro and an extended climate event can knock out pumped-hydro.

In a 1.5C world, true baseload capacity can only come from geothermal or nuclear electricity generation. In the current Australian configuration, it can only come from coal-fired generation. These generators can be phased out as “nearly zero” CO2 generators come on board; until that happens they are needed!

Choosing the level of Baseload Capacity

We can start with the smallest level of demand across the grid. Using South Australia experience (which I examined in an earlier piece), average baseload demand was 2/3rds of average daily demand and minimum baseload daily demand was 45% of peak demand.

On this basis, as a rule of thumb, we could say that baseload demand should be set at 45% of average demand, with renewables and natural gas to compete for supplying the rest of the demand. In the event of climate crisis knocking out renewables, storage can be partly replenished on a daily basis by running any natural gas peaking demand on a 24/7 basis. Added to this, government mandated demand management could be used to help the community to power through such an event.

To make all of this work, Australia needs a “baseload protection plan”. We cannot rely upon current AEMO modelling and pricing to deliver on this without some changes to the model.

Coal-fired Baseload electricity

At present, the only option for baseload electricity is coal-fired electricity, even though to meet the 1.5C objective, it must be progressively phased out. Based on published emission intensity data, in NSW, Liddell should not be included in any “baseload protection plan”; in QLD, Gladstone should not be included; and in Yallourn should not be included. These generators are not needed in a “baseload protection plan.” If these three power stations were taken out of operation, if the remaining operations were guaranteed a market share mandated at 60% of capacity, this would generate enough energy to meet baseload capacity requirements.

Under this plan, 60% of the total 24 hour capacity of the “favoured” generators would be sold into the electricity market at an AEMO calculated cost price plus a risk and profit margin, with a total price of around $A60 MWh. (The current AEMO pricing operation would not apply to this “guaranteed market”; AEMO pricing would apply to all other supply that is not included in the “baseload protection plan.”)

Under this plan, as alternative low-emissions supplies come on stream, these coal-fired generators will begin to lose their guaranteed status, one at a time, until none were included.

Geothermal as a Baseload resource

There have been several abortive attempts to get geothermal up in Australia, with the failure of these projects clearly attributed to economic viability, not on technological grounds. They could not survive under AEMO pricing, despite having the ability to provide electricity at a relatively low cost, assuming that were run 24/7.

European economists have calculated that the wholesale cost of enhanced geothermal electricity is likely to be €50 MWh. This is approximately $A80 MWh. With a small margin for risk and profit, an AEMO fixed price could be $A85 MWh. This compares with the current average price of coal-fired generation of around $A60 MWh. It is trivial for most consumers, being $0.025 per kWh on 45% of the supply, with discounts on various tariffs being as high as $0.23 per kWh. Go figure the angst!

Every MWh of electricity that can be produced on 24/7 by the designated baseload suppliers should have priority in supplying to the grid, with its output being sold at a fixed price before any other electricity generators are able to bid for the remaining electricity demand.

Geothermal should be the first option for Baseload supply and should provide Australia with the mechanism to wind-down the use of coal-fired generators. With Australia’s vast land-mass, it likely that they are many opportunities for geothermal electricity, as the following figure shows.

Hot prospects for geothermal-sourced electricity in Australia.
Hot prospects in Australia for geothermal energy

Nuclear as a Baseload resource

The kind of nuclear that may be acceptable in Australia (using a modular molten-salt reactor) is not yet commercially available. When this kind of reactor has been successfully installed elsewhere, it should be considered here, especially if geothermal does not prove to be a satisfactory solution.

Baseload and Storage

Setting up a “baseload protection plan” doesn’t of itself normally require storage, since this supply is planned to be always available, with the quantum being pitched at the lowest level of demand over a weekly cycle. However, there is a good possibility that, when coal-fired electricity has ended and geothermal and nuclear supply have taken over, there will be occasions when supply will be greater than demand at a particular moment in the cycle. To cover these occasions, rather than curtailing production, it would be preferable if the surplus electricity were stored in a large-scale facility, like Snowy 2.0 pumped-hydro. In this situation it could be sold to that facility at a very low price, such as $A5 MWh, thus providing a negative incentive to owners of the baseload power not to provide more baseload power than is required.

It is recognised that storage is needed to handle the daily and weekly cycles of demand. This disconnect between demand and supply is a natural functions of drawing much of the supply from intermittent renewables. Ironically, the 6 pm peak demand arrives at the very time that solar-generation is quite weak, even on a cloud-free day in Australia.

In addition, a case can be made for some level of natural gas peaking demand, for something like one hour a day. Such a facility could be run 24/7 during any climate event that stops renewables producing electricity, which would reduce the severity of such a crisis in terms of electricity production.

In the normal event, storage from liquid air and batteries can probably handle the week-day cycles, with Snowy 2.0 taking up the surplus supply over the weekend.

Conclusion

Our collective objective should be to manage our use of fossil fuels so that global average temperature stabilises at 1.5C over pre-industrial levels.

The changes suggested here can be undertaken almost immediately and will measurably contribute meeting expectations that Australia’s fossil fuel usage can be drastically cut. (Ethanol for oil is the other limb to this strategy.)

However, to successfully navigate a change of this size, it is necessary to change the AEMO pricing structure to protect coal-fired baseload capacity and to ensure that baseload power in the future is not undermined by aggressive pricing and lobbying on behalf of the operators and owners of wind and solar assets.

CO2e is not a robust measure of GHGs

CO2e calculations should not take into account total methane emissions, but only the changes from the levels of 14 years early.

CO2 equivalent (CO2e) attempts to provide a unified measure of Greenhouse Gas emissions (GHGs). Yet it is neither robust nor truthful, primarily because it fails to take into account the 9.5 years half-life of methane.

Calculating CO2e

To convert methane emissions to CO2e emissions, the estimated methane emissions are multiplied by 25.

Since a half-life for methane of 9.5 years converts to an average life of 13.5 years, it would be more robust if CO2e calculations compared the target year’s methane emissions with those 14 years early and then only the difference between those two years was multiplied by 25.

Modelling Global Warming

When attempting to model the impact of the atmospheric levels of greenhouse gas it is actually much better to use the actual levels of each greenhouse gas to calculate the forcing of each of these gases. These individual numbers can then be combined to arrive at a total forcing level.

Another advantage of this method is that it is based on actual observations, rather than estimated levels of emissions, and uses the published levels of forcings for each gas, most of which have been known since 1990 and earlier, modified slightly in 1996. These figures have not been challenged in the scientific literature since then, as far as I can determine.

Here is the results of this kind of modelling. It clearly supports the scientific argument that GHGs have caused the temperature to rise.

Modelling using atmospheric levels of GHGs, rather than CO2e

Problems arising from using CO2e

Since methane is the second most important GHG, it is essential that its impact is fully understood, even by the ordinary public, but especially by journalists and opinion leaders.

If the method of calculating CO2e had real merit for policy-makers, we should be able to use this method in calculating likely atmospheric methane levels. Following this approach, if we add the methane emissions from 1951 to 2020 to the atmospheric methane in 1950, we should get a result close to the actual atmospheric methane in 2020, namely 1870 ppb. Instead we get 24600 ppb, which just demonstrates the logical problem with CO2e. When we see IPCC graphs of CO2e, stretching out to 2100, we don’t have to take these numbers seriously – they are just “indicative,” but of what is not clear.

The frequently raised issue of the projected levels of meat consumption and its climate consequences is a symptom of the unscientific use of CO2e in climate change advocacy and the simple failure to understand or explain the underlying science to journalists and by journalists to the public.

A proper evaluation of the impact of methane on global warming would not see red meat as the first line of attack; instead, the matter that was first addressed would be fugitive emissions from coal and gas extraction, transport and use. Due to human errors and technical problems, these can easily and unexpectedly give rise to higher methane levels. These will take years to work through the system, whereas additional meat consumption will not lead to significant increases in global average temperatures. Cuts in red meat consumption will be difficult to implement and have a minor impact, in comparison with issues like fugitive emissions.

Conclusion

Unless scientists can find a better way to express CO2e, it would be better if journalists and advocates restrained themselves and only referred to CO2, N2O and the F-gases, each of which has its own story. Methane needs a more nuanced analysis than it currently receives.